Using Heat Maps to Optimize Camera Placement Based on Footage Analysis
You’re already capturing footage, but heat maps turn that data into color-coded insights, showing exactly where people move most. Warm zones highlight high-traffic areas, so you can aim cameras there and reduce blind spots. They reveal gaps where activity happens but isn’t recorded, helping you adjust angles or add coverage. Most systems generate them automatically, though some need a subscription. Let the patterns guide your setup for smarter, evidence-based security that works even when you’re not watching. See how the right tools bring those maps to life.
Notable Insights
- Use heat maps to identify high-traffic zones by visualizing movement patterns from camera footage.
- Detect blind spots where lack of activity data reveals gaps in surveillance coverage.
- Align camera angles with heat intensity areas to maximize visibility of critical zones.
- Combine heat map data with access logs to verify expected vs. captured activity.
- Optimize camera placement by focusing coverage on frequently used pathways and entry points.
What Are Heat Maps in Security?
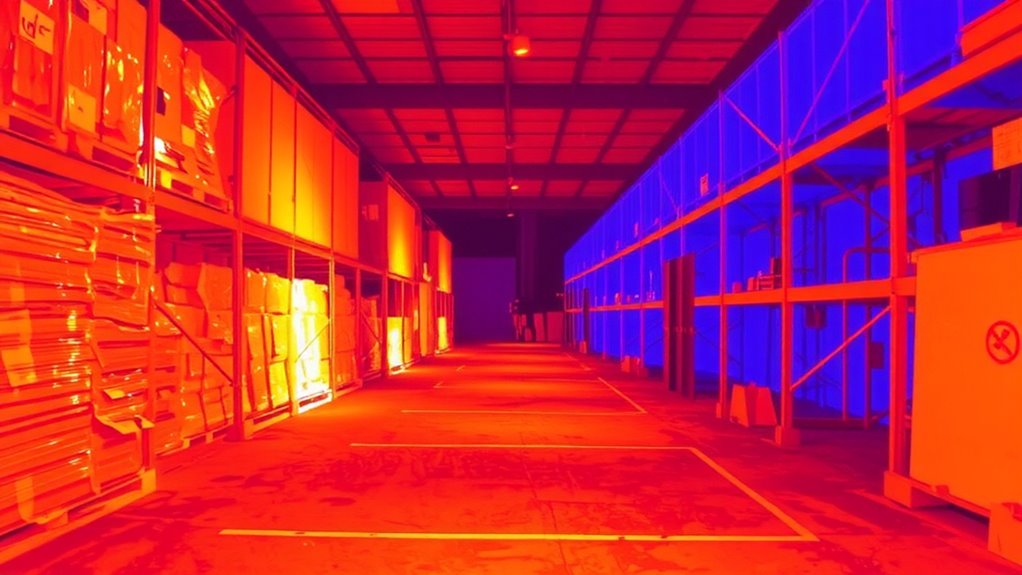
While you’re setting up a home security system, understanding where activity happens most can make a big difference-and that’s where heat maps come in. These visual tools use motion detection data from your cameras to show which areas experience the most movement over time. You’ll see warmer colors like red and orange where activity is frequent, and cooler colors like blue where it’s rare. Heat maps help you focus on real patterns instead of guesswork, improving threat assessment by highlighting high-risk zones. You can adjust camera angles to cover these hotspots, ensuring no blind spots. Most modern security systems generate heat maps automatically, though some require a subscription. They work best when reviewed weekly or monthly, giving you time to spot trends. While they don’t replace active monitoring, they’re a smart way to place cameras where they’re needed most-saving time, money, and improving overall security coverage.
Why Heat Maps Beat Guesswork
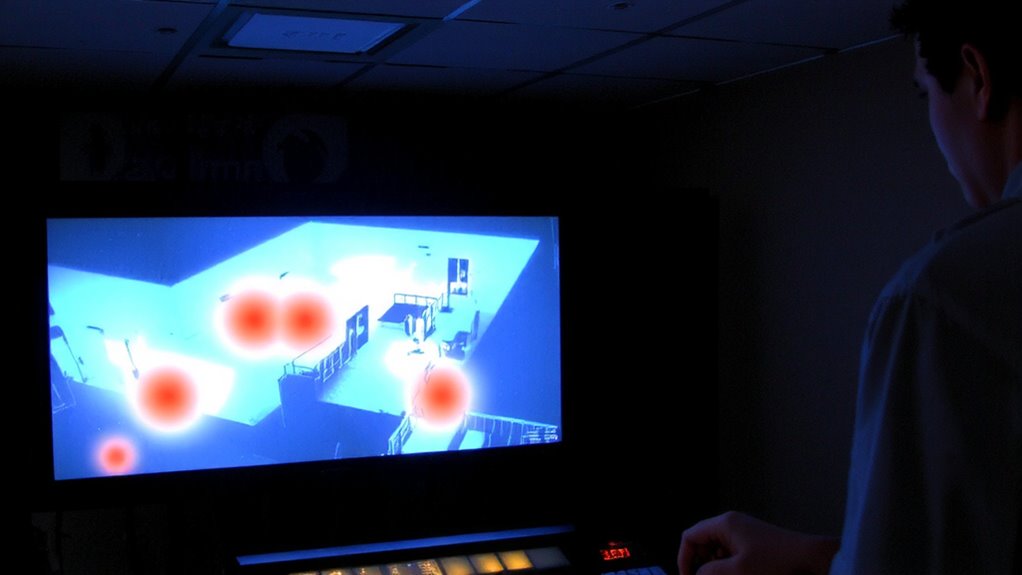
You can spot patterns in how people move through your property just by looking at your security camera footage over time, but counting instances and guessing high-traffic areas isn’t reliable. Heat maps use actual movement data to deliver clear visuals, giving you far better data accuracy than memory or assumptions. Instead of guessing where issues might occur, you get evidence-based insights that support smart risk prediction. You’ll see exactly where people linger, enter, or pass through most often, letting you place cameras where they’ll do the most good. This method reduces blind spots and wasted coverage. With heat maps, decisions rely on facts, not hunches. You save time and money while improving security effectiveness. It’s simple: better data means better planning, stronger protection, and smarter use of your budget in the long run.
Map High-Traffic Areas With Heat Data
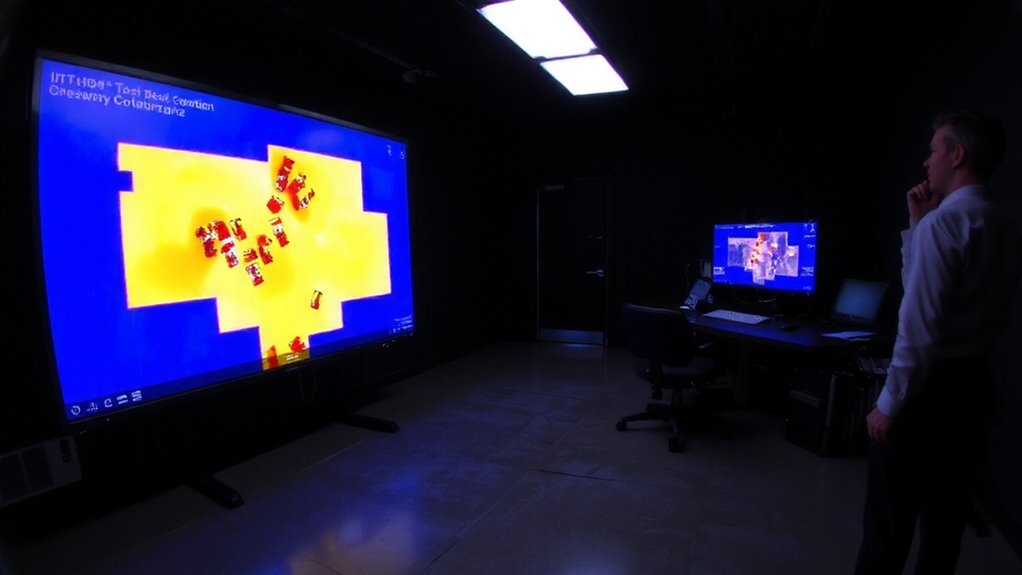
Where are people actually going on your property-or not going, but should be monitored anyway? Heat data reveals this clearly, turning raw footage into visual maps of activity. You can see high-traffic zones at a glance, using thermal imaging to detect body heat and motion tracking to follow movement patterns over time. These tools show not just how often an area is used, but when and how people move through it. Hot spots near doors, walkways, or blind corners should get priority for camera coverage. Thermal imaging works in darkness or poor visibility, while motion tracking logs frequency and direction. Together, they provide reliable, data-driven insight. Mapping these areas helps you place cameras where they’ll capture the most relevant activity. You avoid wasting resources on low-use zones and focus on what matters. It’s a practical, evidence-based method to boost your surveillance efficiency without guesswork.
Find Security Blind Spots With Heat Maps
What if the most vulnerable spots on your property aren’t where you think they are? Heat maps reveal gaps in surveillance by showing areas with little or no activity captured, indicating potential blind spots. You might assume all zones are covered, but without data, you’re guessing. Thermal imaging helps detect movement in low visibility, uncovering overlooked zones like shadowed corners or behind structures. When combined with access control logs, you can correlate authorized entries with actual camera coverage, spotting mismatches. For example, if someone uses a side door with valid access but isn’t recorded, that area lacks coverage. These insights let you prioritize camera placement where it’s needed most. While thermal cameras cost more, their ability to capture heat signatures improves accuracy. Use heat data not just to confirm activity, but to find where your security fails silently. Address those gaps, and your system becomes proactive, not just reactive.
Adjust Camera Angles Based on Heat Patterns
Heat maps don’t just expose blind spots-they also show exactly how to fix them by guiding camera angle adjustments. You can use the intensity patterns to tilt or reposition cameras for better coverage. Areas with frequent movement should be in clear view, while dark zones on the map may need lower angles or additional units. Always consider lighting conditions when adjusting-shadows or glare can distort footage and reduce detection accuracy. Proper camera calibration guarantees the heat map matches real activity, improving reliability. Review footage alongside map data to confirm alignment. For optimal results, choose a wired security camera system that provides stable, continuous recording for accurate heat map generation.
| Adjustment | Impact |
|---|---|
| Lower angle | Covers more floor activity |
| Higher angle | Reduces glare from lights |
| Pan left/right | Eliminates side blind spots |
| Recalibrate | Aligns feed with heat data |
Use These Tools to Generate Security Heat Maps
How do you turn raw security footage into actionable insights? You use tools that process video data into security heat maps. With motion tracking, software analyzes movement patterns over time, highlighting frequently traveled areas. Thermal imaging adds another layer, detecting heat signatures to spot activity in low visibility. Together, these technologies help you see where people go most, day or night. Tools like Milestone XProtect and Heatmap.com use your camera feeds to generate color-coded maps-red for high traffic, blue for low. They’re easy to set up, though higher-end versions cost more. Look for systems that offer integration with your existing cameras and real-time updates. Avoid tools without customizable time filters or export options. By relying on data, not guesses, you place cameras where they’ll do the most good.
On a final note
You can use heat maps to make smarter camera placement decisions by showing exactly where people move most. Data from footage reveals high-traffic zones and blind spots you might miss. Adjusting angles based on heat patterns improves coverage. Tools that generate these maps vary in cost and ease of use, but most offer clear, useful insights. Planning with heat data helps you get the most value and protection from your system.