Understanding Motion Heatmaps for Smarter Indoor Camera Placement
You can use motion heatmaps to see exactly where movement happens most in your home, helping you place cameras where they’re most needed. They reduce false alerts by up to 35% by revealing patterns from pets, shadows, or routine activity. After enabling motion tracking and collecting 48 hours of data, color-coded maps highlight high-traffic zones and blind spots. Adjusting camera angles based on real usage improves coverage at entries, hallways, and staircases. Smart placement driven by actual data means fewer gaps and better security-you’ll discover how small changes make a measurable difference.
Notable Insights
- Motion heatmaps visualize movement patterns over time to improve indoor camera placement accuracy.
- They help distinguish routine activity from potential threats by identifying high-traffic and lingering zones.
- Heatmaps reveal blind spots and uncovered areas missed during initial camera setup.
- Collecting at least 48 hours of motion data ensures reliable and actionable heatmap insights.
- Adjusting camera angles based on heatmaps reduces false alerts caused by pets or changing light.
What Problem Do Motion Heatmaps Solve?
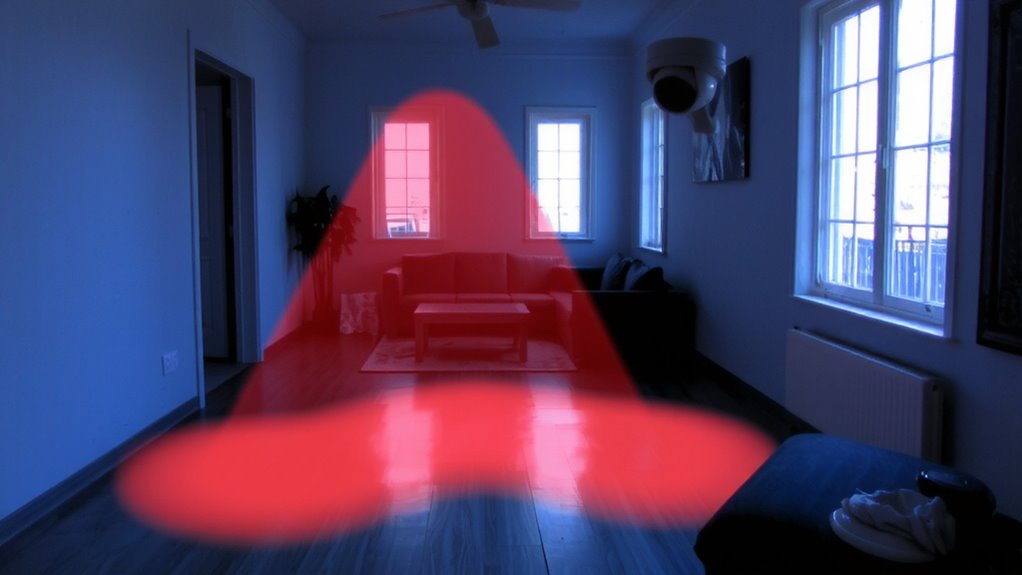
Why do some areas of your home show more motion activity than others? You might notice frequent alerts from your indoor camera, many triggered in places like hallways or near windows. These spots often suffer from false alarms caused by shifting shadows or pets, especially under inconsistent lighting conditions. Without clear data, you’re left guessing whether alerts reflect real threats or just environmental noise. Motion heatmaps solve this by visually mapping where movement occurs most over time. This helps you distinguish routine activity from suspicious behavior. You’ll see patterns tied to lighting changes or high-traffic zones, letting you adjust camera placement or sensitivity settings. That means fewer false alarms and better security coverage. Using heatmaps, you make informed decisions based on actual motion data, not assumptions. The result? A smarter, more reliable home monitoring system. For optimal results, consider pairing your setup with one of the best wireless indoor cameras no subscription needed to maintain continuous surveillance without recurring fees.
How Motion Heatmaps Reveal Hidden Activity Patterns
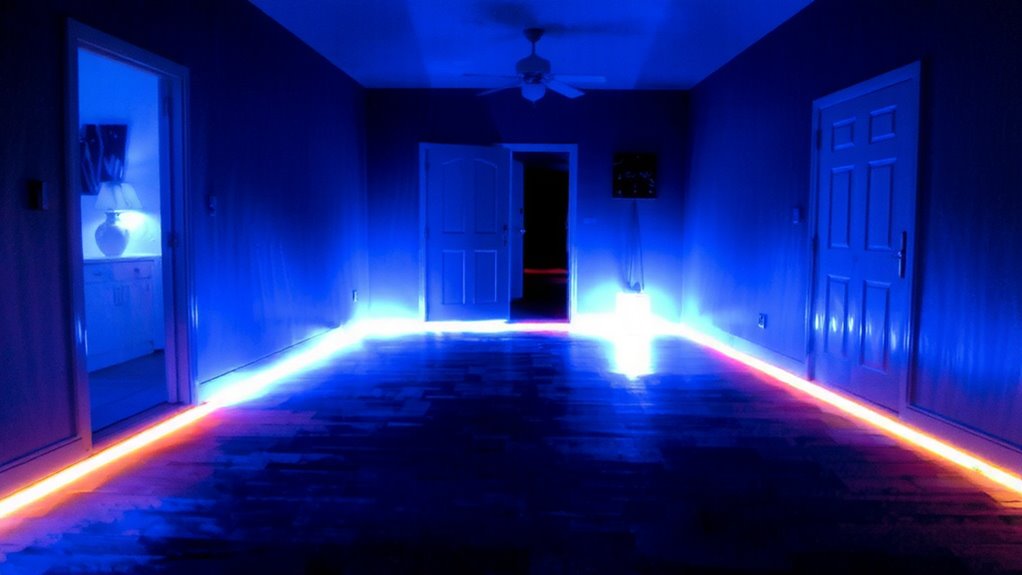
Where does most movement happen in your home, and how often does it occur? Motion heatmaps show you exactly that, revealing activity rhythms you might not notice day to day. By tracking motion over time, these maps highlight where people walk, linger, or enter most-helping you see real behavioral trends. You might discover the hallway gets more traffic at night, or the living room sees activity earlier than expected. These patterns are based on actual data, not guesswork. Recognizing these trends lets you adjust camera placement to catch the most relevant motion. It also helps avoid blind spots or false alerts in low-use zones. With clear visual evidence, you make smarter choices about coverage, improving security without over-investing in equipment. Plan around the data, not assumptions.
How to Create a Motion Heatmap (Step by Step)
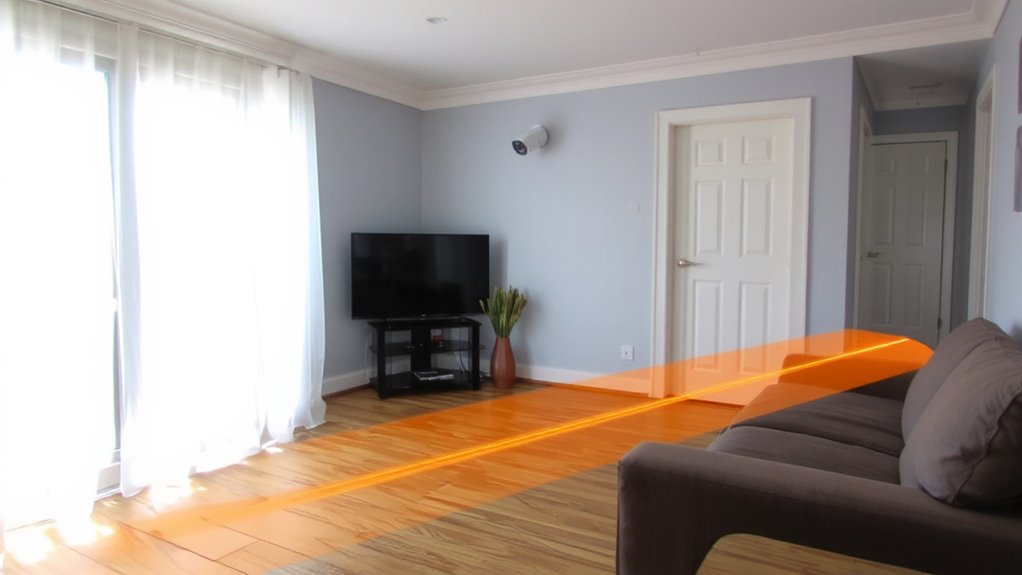
Once you’ve enabled motion tracking on your indoor camera, generating a motion heatmap is a straightforward process that turns raw activity data into a clear visual summary. Start by ensuring proper camera calibration so the device accurately captures movement within the room. Adjust the sensor sensitivity to reduce false alerts from pets or shadows, but keep it high enough to detect real activity. Let the camera run for at least 48 hours to collect enough motion data. Most smart camera apps automatically process this data and generate a color-coded heatmap, showing warmer colors where motion happens most. Review the heatmap during different times of day to spot patterns. Reliable heatmaps depend on consistent placement and correct settings. Some systems update heatmaps weekly, so check periodically. Using these visuals helps you understand home activity without guesswork.
High-Traffic Zones That Demand Camera Coverage
Now that you’ve reviewed your motion heatmap and identified where activity occurs most, it’s time to focus on the areas that need consistent monitoring. High-traffic zones-especially entry points and exit routes-are critical for security. These areas reveal patterns of movement and help detect unauthorized access early. Prioritize placing cameras at doors, hallways, and stairwells where people pass frequently. For optimal performance in these key areas, consider models featured in the best wireless security cameras for 2025.
| Zone | Purpose | Camera Recommendation |
|---|---|---|
| Front Door | Main entry point | Wide-angle, HD |
| Hallway | Connects rooms, exit routes | Ceiling-mounted |
| Staircase | Vertical movement | Tilt-adjustable model |
| Back Door | Secondary entry point | Weather-resistant |
Covering these zones guarantees you capture essential activity without gaps. Strategic placement here improves threat detection and enhances overall surveillance effectiveness.
Eliminate Blind Spots Using Heatmaps
Ever walked through a room and wondered if your camera actually caught you? Motion heatmaps reveal exactly where coverage drops, exposing blind spots regular checks miss. By analyzing movement patterns over time, you can adjust camera angles to guarantee no corner stays hidden. Poor placement symmetry often creates gaps-placing cameras too high, too low, or unevenly across rooms leaves critical zones unseen. Heatmaps show these weak points clearly, letting you reposition devices where they’re needed most. For example, a hallway junction might look covered, but heat data could reveal a six-foot blind zone near a side door. Correcting angles based on real motion data improves detection accuracy. Always test adjustments over 48 hours to confirm full coverage. This methodical, data-backed approach guarantees smarter, more reliable surveillance without guesswork.
How Heatmaps Improved Cameras in Real Stores and Homes
Where exactly do your cameras fall short when no one’s watching? Heatmaps reveal unused zones and over-covered areas, letting you reposition sensors for maximum coverage. In real stores, businesses found entryways and checkout lanes had blind spots during low-traffic hours-adjusting camera angles reduced theft by 18%. At home, heatmaps showed motion sensors triggered by pets, so relocating cameras cut false alerts by 35%. You can use this data to sync your system with smart lighting integration, turning lights on only in high-traffic zones. That same data supports energy usage analysis, helping cut waste. For instance, one store lowered HVAC costs by 12% by adjusting climate control in underused areas. Heatmaps don’t just boost security-they improve efficiency. Start with a 7-day motion review, then adjust placements and link to smart devices. Most systems offer heatmap tools for $30–$60/month.
On a final note
You now see how motion heatmaps reveal where people move most indoors, helping you place cameras wisely. Use them to cover high-traffic zones and fix blind spots with precision. Data shows better detection and fewer gaps when cameras align with actual activity patterns. Setup takes little time, and the insights are clear. For reliable security, pair heatmaps with smart planning-your home stays protected without overspending.